Lab Debug
- Due Jan 30, 2022 by 10p.m.
- Points 1
Assignment Description
Learn how to debug your code!
Introduction to Debugging
Alice is writing an image recognition program. She’s working on the tracing algorithm, which turns the image into a trace of the outlines in the image. After going through all the compiler errors (sketchify.cpp:13, etc), the program finally compiles! Overjoyed to have a program, she decides to test it on a couple images.
Segmentation Fault
Ouch. What does she do now? She has to debug her code.
Follow instructions from lab_intro on setting up the directory and downloading the code.
You can get the files for this lab by downloading lab_debug.zip.
Determining What’s Going Wrong
Alice could open sketchify.cpp and try to figure out what’s happening. This is good for logical bugs — when you only rotate half of your image, for example, or the image doesn’t rotate at all. Walking through what your code does to yourself or your partner is a good exercise in debugging bugs in your algorithm. However, this is often a poor choice for debugging runtime errors or general code bugs. In this case, you should attempt to use the following workflow to debug your code (taken mostly from “DEBUGGING: The 9 Indispensable Rules for Finding Even the Most Elusive Software and Hardware Problems” by David J. Agans):
Debugging Workflow
-
Understand the System.
- Without a solid understanding of the system (the system defined as being both the actual machine you are running on as well as the general structure behind the problem you are trying to solve), you can’t begin to narrow down where a bug may be occurring. Start off by assembling knowledge of:
- What the task is
- What the code’s structure is
- What the control flow looks like
- How the program is accomplishing things (library usage, etc)
- When in doubt, look it up—this can be anything from using Google to find out what that system call does to simply reading through your lab’s code to see how it’s constructed.
- Without a solid understanding of the system (the system defined as being both the actual machine you are running on as well as the general structure behind the problem you are trying to solve), you can’t begin to narrow down where a bug may be occurring. Start off by assembling knowledge of:
-
Make it Fail.
- The best way to understand why the bug is occurring is to make it happen again—in order to study the bug you need to be able to recreate it. And in order to be sure it’s fixed, you’ll have to verify that your fix works. In order to do that, you’ll need to have a reproducible test case for your bug.
- A great analogy here is to turn on the water on a leaky hose—only by doing that are you able to see where the tiny holes might be (and they may be obvious with the water squirting out of them!).
- You also need to fully understand the sequence of actions that happen up until the bug occurs. It could be specific to a certain type of input, for example, or only a certain branch of an if/else chain.
-
Quit Thinking and Look.
- After you’ve seen it fail, and seen it fail multiple times, you can generally have an idea of at least what function the program may be failing in. Use this to narrow your search window initially.
- Start instrumenting your code. In other words, add things that print out intermediate values to check assumptions that should be true of variables in your code. For instance, check that that pointer you have really is set to
NULL. - Guessing initially is fine, but only if you’ve seen the bug before you attempt to fix it. Changing random lines of code won’t get you to a solution very fast, but will result in a lot of frustration (and maybe even more bugs)!
-
Divide and Conquer.
- Just like you’d use binary search on an array to find a number, do this on your code to find the offending line! Figure out whether you’re upstream of downstream of your bug: if your values look fine where you’ve instrumented, you’re upstream of the bug (it’s happening later on in the code). If the values look buggy, you’re probably downstream (the bug is above you).
- Fix the bugs as you find them—often times bugs will hide under one another. Fix the obvious ones as you see them on your way to the root cause.
-
Change One Thing at a Time.
- Use the scientific method here! Make sure that you only have one variable you’re changing at each step—otherwise, you won’t necessarily know what change was the one that fixed the bug (or whether or not your one addition/modification introduces more).
- What was the last thing that changed before it worked? If something was fine at an earlier version, chances are whatever you changed in the interim is what’s buggy.
-
Keep an Audit Trail.
- Keep track of what you’ve tried! This will prevent you from trying the same thing again, as well as give you an idea of the range of things you’ve tried changing.
-
Check the Plug.
- Make sure you’re assumptions are right! Things like “is my Makefile correct?” or “am I initializing everything?” are good things to make sure of before blindly assuming they’re right.
-
Get a Fresh View.
- Getting a different angle on the bug will often times result in a fix: different people think differently, and they may have a different perspective on your issue.
- Also, articulating your problem to someone often causes you to think about everything that’s going on in your control flow. You might even realize what is wrong as you are trying to describe it to someone! (This happens a lot during office hours and lab sections!)
- When talking to someone, though, make sure you’re sticking to the facts: report what is happening, but not what you think might be wrong (unless we’re asking you what you think’s going on).
-
If you didn’t fix it, it ain’t fixed.
- When you’ve got something you think works, test it! If you have a reproducible test case (you should if you’ve been following along), test it again. And test the other cases too, just to be sure that your fix of the bug didn’t break the rest of the program.
Basic Instrumentation: Print (cout) Statements!
The easiest way to debug your code is to add print statements. To do this, you can add comments at various points in your code. We added these statements at the top of the file:
#include <iostream>
using namespace std;
so you can print messages to standard output. Here’s an example:
cout << "line " << __LINE__ << ": x = " << x << endl;
__LINE__ is a special compiler macro containing the current line number of the file.
The above line prints out the current line number as well as the value of the variable x when that line number executes, for example:
line 32: x = 3
Print statements work for debugging in (almost) any language and make repeated debug testing easy — to repeat debug testing with a new change, all you need to do is compile and run the program again. They also require nothing new to learn (smile) .
Debugging Alice’s Code
A single test case is provided in the testsketchify.cpp. To compile and run the test, type the following into your terminal:
make test
./test
The test will sketchify the UBC CS logo and compare it against the sample output in the given_imgs folder. The test will pass if the output matches with the sample output.
Alice’s First Bug
As you can see, Alice’s code caused a Segmentation Fault, or segfault. This happens when you access memory that doesn’t belong to you — such as dereferencing a NULL or uninitialized pointer.
Try adding print statements to lines 46 and 50, before and after the calls to original->readFromFile(), width(), and height().
cout << "Reached line 46" << endl;
cout << "Reached line 50" << endl;
Now run sketchify again. You’ll see line 46 print out, but not line 50. This means the segfault occurred sometime between executing lines 46 and 50. We’ll let you figure out what the bug here is and how to fix it. You’ll see “line 50” print to the terminal once you’ve finished — then move on to Bug 2, below.
Bug 2
Once you’ve fixed the first bug, you’ll get another segfault. You’ll want to narrow down the line it’s occurring on and its cause by printing more information. Try putting cout statements at the beginning and end of the inner for loop. Sometimes a bug will cause your program to run in an infinite loop: you can press CTRL-C to terminate execution.
Note that you will see the following warning when you run “make” - your code will still run with this warning, but you should try to fix this in order to avoid unexpected behavior.
warning: address of stack memory associated with local variable 'pixel'
returned [-Wreturn-stack-address]
    return &pixel;
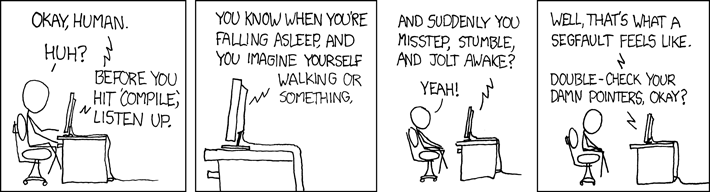
image source: https://xkcd.com/371/
Links to an external site.
More debugging!
No more segfault! However, the test is still failing. Try to open out.png and compare it with the sample output (see the section below). Once you think sketchify is working, add more tests to testsketchify.cpp with different images.
Alice’s code, like most of ours, isn’t perfect. But fixing it is as simple as repeating the above to learn more about what the program is actually doing at runtime so that you can solve the issues. Read through the specifications carefully and pay attention to the details. Good luck!
Checking Your Output
If the test is unhelpful, you can open each image up using a graphical viewer. Mac OS users, please install XQuartz
Links to an external site., and ensure you have ssh into the remote ugrad server using the -Y flag:
xdg-open out2.png &
xdg-open given_imgs/out_2.png &
Or compare them using compare:
compare out2.png given_imgs/out_2.png comparison.png
xdg-open comparison.png &
Differences will be highlighted in red.
How good are the tests?
You are probably familiar with the concept of Test coverage from CPSC 210. It measures how much of the source code is executed when a particular test suite runs. To generate a test coverage report, type
make test
./test
make coverage
It will compile, run, and generate a coverage report by file in the command line, as well as coverage.html which is a line-oriented coverage report that tells you how many times a line is executed.
Marking Your Work
We’ll be grading all of the labs this semester using an autograder provided by PrairieLearn. The lab will appear under the Assessments heading, and you will be able to drag and drop your required files into that space. We will run a very few simple test cases on your code, and if you pass any of them, you will get credit for the programming portion of the lab. (It’s a low bar.)
Submitting the lab is as simple as dragging your completed code into the PrairieLearn interface for the lab_debug assignment.
Please submit the following file:
- sketchify.cpp
Good luck!
Additional Resources
- Pointers refresher Links to an external site.
- More pointers Links to an external site.
- GDB tutorial Links to an external site.
Turning in your work:
Please submit your solution to this lab on PrairieLearn PrairieLearn Links to an external site.
 Find Rubric
